
Technical Cleanliness: Particle Identification, Not Just Counting
A cleanliness report comes back from the lab with a particle count, a size distribution and a pass or fail against the customer specification. It says nothing about where those particles came from. The count tells you that you have a problem. Particle identification tells you which process step caused it.
That gap is where most technical cleanliness programmes stall. The counting is automated, repeatable and audited. The root cause hunt afterwards is still three departments in a room with a theory.
What technical cleanliness standards actually measure
ISO 16232 and VDA 19.1 describe how a component is extracted, how the extraction liquid is filtered, and how the particles caught on that filter are counted and sized. The 2018 revision of ISO 16232 consolidated ten earlier parts into one document and was written to align with VDA 19.1, so a supplier in Brabant and a customer in Baden-Wurttemberg work to substantially the same procedure.
The detail that matters for anyone who has to act on the report: the standard is built around quantification. It counts particles and it sizes them. It does not require you to establish what they are made of.
That is a reasonable place for a standard to stop. A specification limit needs a number. But a number does not close a corrective action, and the supplier on the other side of the table knows it.
Why the count alone does not close the issue
Four particles in the same size class can have four different origins, and each one sends you to a different part of the line.
- A machining chip points at cutting, deburring or the chip extraction itself
- A polymer fragment points at a seal, a hose, a gripper or a conveyor belt
- A textile fibre points at packaging, work clothing or the handling protocol
- A residue crystallised out of the washing bath points at the cleaning line
Report them all as "particles above the limit" and every one of those departments can argue it is not theirs. Report them as polyamide, nitrile rubber, cellulose and a salt deposit, and the conversation is over in ten minutes.
How FT-IR microscopy identifies a particle on the filter
The filter is the sample. An infrared microscope views the membrane directly, locates the particles optically, and measures a spectrum on each one. That spectrum is a molecular fingerprint, and comparison against a spectral library names the material: polymers, elastomers, fibres, greases, additives, adhesives and organic residues.
The LUMOS II FT-IR microscope is built around that workflow. Bruker describes its Particle Identification function as one that "detects particles within IR and Raman chemical images, determines their dimensions, and identifies their chemical makeup, all in one go", so the sizing the standard asks for and the identification the engineer needs come out of the same measurement.
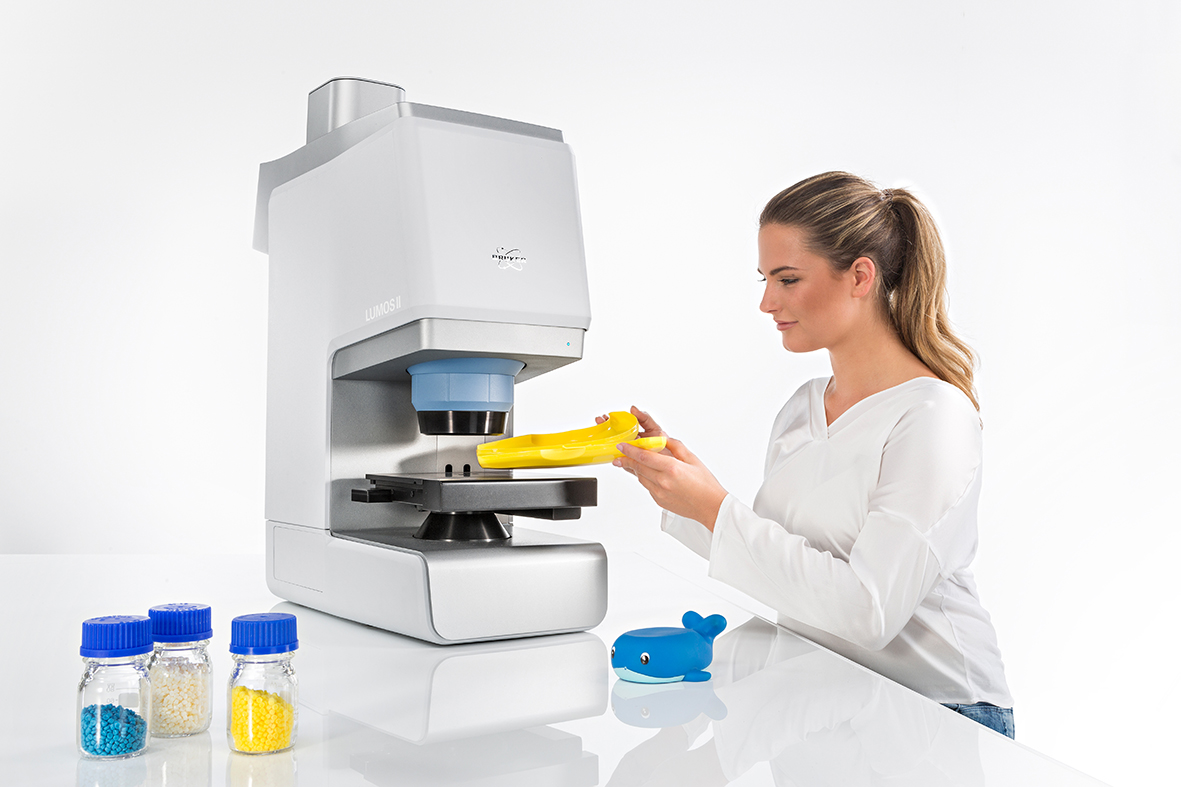
The ATR crystal sits inside the objective. Bruker states that "the retractable crystal is controlled by high precision piezoelectrical motors and integrated into the lens". In daily use that removes the step people get wrong most often, which is swapping objectives and lowering a crystal onto a loose particle by hand, several hundred times, without losing it.
Where it goes wrong
This is the part suppliers tend not to write down.
Infrared sees molecules, not elements. A steel chip, an aluminium fleck and a copper particle look broadly alike to an infrared beam. Cleanliness labs pair infrared with scanning electron microscopy and X-ray analysis for exactly that reason. Use each for what it does well: infrared for the organic fraction, electron microscopy for the metallic one.
The membrane sits underneath every spectrum. A filter with strong absorption bands of its own contributes to every particle you measure. Choose the membrane for the analysis as well as for the filtration step, and measure a piece of clean membrane as a reference before you start.
Small particles are harder than the brochure suggests. As particles approach the diffraction limit of mid infrared light, the measured spectrum increasingly mixes the particle with what surrounds it. Identification stays possible well below the visual limit, but the confidence drops and someone has to be honest about where.
A library hit is not a result. A match factor tells you how similar two spectra look. On a filled and pigmented compound the top hit can be plausible and wrong. A spectroscopist still looks at the spectrum.
Your own lab contaminates the filter. Fibres from sleeves, dust from the bench and residue from the extraction fluid all end up in the count. Run blank filters, and treat a result without one as provisional.
What changes once identification is routine
The corrective action narrows from a line to a component. The supplier discussion moves from volume to material. Requalification after a process change becomes a measurement rather than an argument, because you can show that the fibre that used to appear on every filter no longer does.
None of that requires a different extraction or filtration method. The filters you already produce under ISO 16232 are the samples. What changes is what happens to them afterwards.
FAQ
What is technical cleanliness?
Technical cleanliness is the assessment of particulate contamination on functionally relevant surfaces of a component, measured by extracting the particles, filtering the extraction liquid, and counting and sizing what remains on the filter. It is standardised in ISO 16232 and in the VDA 19.1 recommendation.
Does ISO 16232 require chemical identification of particles?
No. The standard is built around counting and sizing particles, with defined extraction and filtration procedures. Material identification is an additional analysis that laboratories add when they need to trace contamination back to its source rather than only report it.
Can FT-IR identify metal particles?
Not directly. Infrared spectroscopy identifies molecular structures, so it names polymers, rubbers, fibres, greases and organic residues. Metallic particles are identified with scanning electron microscopy and X-ray analysis. Most cleanliness laboratories use the two techniques side by side.
What is the difference between FT-IR microscopy and SEM/EDX for cleanliness analysis?
FT-IR microscopy gives the molecular composition of organic particles and distinguishes materials that share the same elements, such as different polymers. SEM with EDX gives elemental composition and excels on metals and inorganics. Neither replaces the other on a mixed filter.
Do I need to change my filtration method to add identification?
Usually not. The filters generated by an existing ISO 16232 workflow can be measured directly, provided the membrane is suitable for infrared analysis. Membrane choice is the one thing worth reviewing before you start.
See it on your own samples before you decide
I am Savas Kaplan, and I represent Bruker Optics as its agent for the Netherlands and Belgium. The instrument comes from Bruker. I am the person here who arranges the demonstration, the measurement on your own material, and the configuration that fits what you actually measure.
If you are weighing up an instrument for cleanliness work, send me filters from a part that failed. We measure them on the system you are considering, you see the spectra and the identifications, and I say plainly which particles the technique could not resolve. That is the fastest way to find out whether the instrument answers the question you actually have, and it costs you nothing but a padded envelope.
Arrange a measurement on your own samples and tell me which system you are looking at and which process step you suspect. If the result confirms it, you have your evidence and you know what the instrument does for you. If it does not, you have saved yourself a purchase that would not have solved the problem.
Further reading: Defect analysis using FT-IR microscopy and Bruker's short film on particle identification for root cause analysis.