Forensic investigations commonly involve the collection of textile fibers when examining crime scenes. The need to characterize and identify those fibers is vital as they can provide extensive information relating to a crime, tying a suspect to a location. Microscopic fibers in particular can present problems in terms of both size and quantity of sample. Fourier transform Infrared spectroscopy (FT-IR) presents a nondestructive method to identify those fibers. FT-IR can be coupled with microscopy presenting the ability to provide a forensic examiner with both detailed visual microscopic information and simultaneous material identification.
Douglas Deedrick from the FBI stated, “The likelihood of two or more manufacturers duplicating all aspects of the fabric type and color exactly is extremely remote,” further exemplifying the importance of fibers at a crime scene and the need to characterize them. Infrared spectroscopy is invaluable for determining the material properties of single fibers.2,3 Whether the fibers of interest are synthetic, natural or a hybrid of the two in composition, they will exhibit unique spectral features when interrogated under infrared light. Fundamental vibrations caused by the absorption of infrared light correspond to structural composition that make up the fibers and dyes commonly used. The advantage of the SurveyIR to assist the forensic examiner in characterizing microscopic fibers is presented in this application note.
Results & Discussion
Traditional FT-IR microscopes are costly, complex systems requiring well-trained personnel to operate and commonly involve the use of liquid nitrogen to cool the mercury cadmium telluride (MCT) detectors. The SurveyIRTM provides a less costly, simplified microscope accessory that can be paired with most commercially available benchtop FT-IR spectrometers. By using the instrument mounted detector, the need for liquid nitrogen for cooling the MCT detector may be eliminated. The live image feed from eSpotTM software allows for simultaneous viewing and spectral data collection. Due to the accessory’s all reflective design, the spectral range is limited by the spectrometer optics exclusively. The SurveyIR has the ability to switch between reflectance and transmittance collection modes as well as a clip-on view-through attenuated total reflection (ATR) accessory.

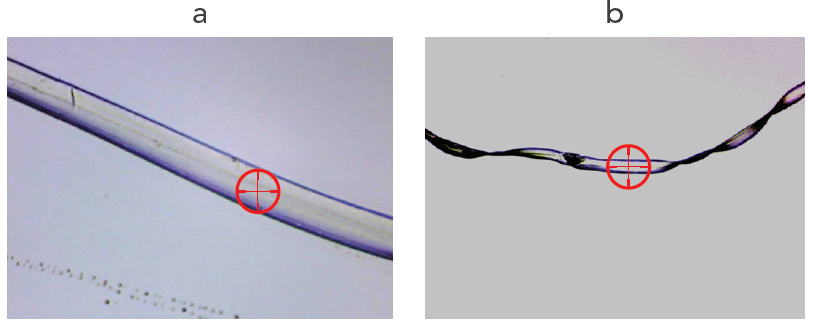
(a) and polyamide (b). Red crosshairs indicate the sampling position
at an aperture size of 60μm.
The images in figs 1 and 3 represent fibers extracted from woven fabric. The fibers were cut into small lengths (13mm), rolled flat via roller knife on plain glass microscope slides, and then transferred to Low-E glass microscope slides for analysis. The left image of polyamide (Fig. 1, a) shows a transparent fiber about 60μm in diameter. The right image of polyester (Fig.1,b) is slightly less than 60μm wide. Due to the sample preparation technique used, structural appearance of these two fibers is very similar as both fibers appear to be similar in size and transparency; however, their corresponding IR spectra clearly represent two different materials.

FT-IR spectra were collected by reflectance at 8cm-1 resolution and coadded 64 scans. The bottom spectrum (Fig.2) of a polyamide, exhibits spectral features consistent with nylon 6,6, poly(hexamethylene apidamide). The top spectrum (Fig. 2) is consistent with polyethylene terephthalate, PET. Both of these fibers can be differentiated utilizing FT-IR spectroscopy and identified using spectral library searching methods.

(left, c) and silk (right, d). Red crosshairs indicate sampling are with
both apertures set to 60μm.
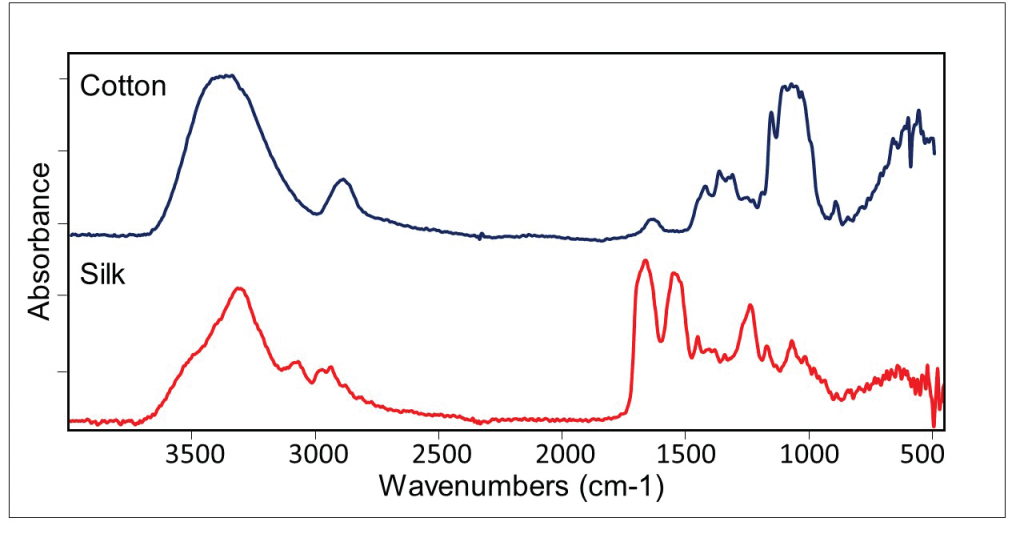
Cotton and silk are well-known textiles and also some of the oldest known. Cotton has been found in archeological sites dating back as early as 5000-6000 BC. Likewise, silk has history dating back to ancient Chinese civilizations, usually in the hands of the emperors or elite members of society. Both of these materials have very different textures, as cotton is known to be soft and fluffy where silk is very smooth and lustrous. Unlike the synthetic fibers, the images in Fig.3 exhibit apparent differences as silk (d) appears very smooth compared to cotton (c) which has small inconsistencies. The composition of the two is completely natural; however, cotton is comprised of almost completely of cellulose and silk, protein.

The IR spectra seen in Fig. 3 of silk (red) has distinct peaks associated with N-H structural units around 3300cm-1 and amide bands I and II at 1661 and 1532cm-1, respectively. Cotton (Fig. 3, blue) on the other hand has an absence of amide bands I and II (peaks 1661 and 1532cm-1) and a broadened peak at 3380cm-1 due to extensive hydrogen bonding in the cellulose structure. The broaden peak at 1085cm-1 (blue) is associated with cellulose structure as a combination of C-C, C-OH, C-O-C stretches. The ability of FT-IR to differentiate the two natural fibers is apparent and can be referenced against a library for identification purposes.
Conclusion
FT-IR microspectroscopy utilizing Czitek’s SurveyIR proves to be a useful tool in identifying and interrogating small fibers. Single fiber analysis can be accomplished without sample destruction and reference images captured for later presentation and sample position validation. The resulting spectra from both natural and synthetic fibers were identified utilizing library searches and further verified by key characteristic fundamental IR vibrations. The uniqueness of IR vibrational spectroscopy is proven in both of the synthetic and natural fibers analyzed providing certainty for identification purposes. To the forensic examiner, certainty is imperative for evidence that is to be used in the court. The ability of SurveyIR to switch between different sampling methods (ATR, Transmittance, Reflectance) presents an effective, easy to use toolset for theforensicexaminer.
References:
- Deedrick, Douglass W. “Hairs, Fibers, Crime, and Evidence Part
2: Fiber Evidence.” Forensic Sci. Comm., 2, 3 (2000). - ASTM E2224 – 10 , “Standard Guide for Forensic Analysis of
Fibers by Infrared Spectroscopy,” ASTM International, 100 Barr
Harbor Drive, PO Box C700, West Conshohocken, PA. - “A FORENSIC FIBER EXAMINER TRAINING PROGRAM,”,
Scientific Working Group for Materials Analysis (SWGMAT),
https://archives.fbi.gov/

